Overview
The Workspaces & Reports Statistics dashboard in Alluvial provides insights into how users are interacting with content—particularly Power BI reports and container applications—within your project.
Getting Started
Access the Statistics Dashboard
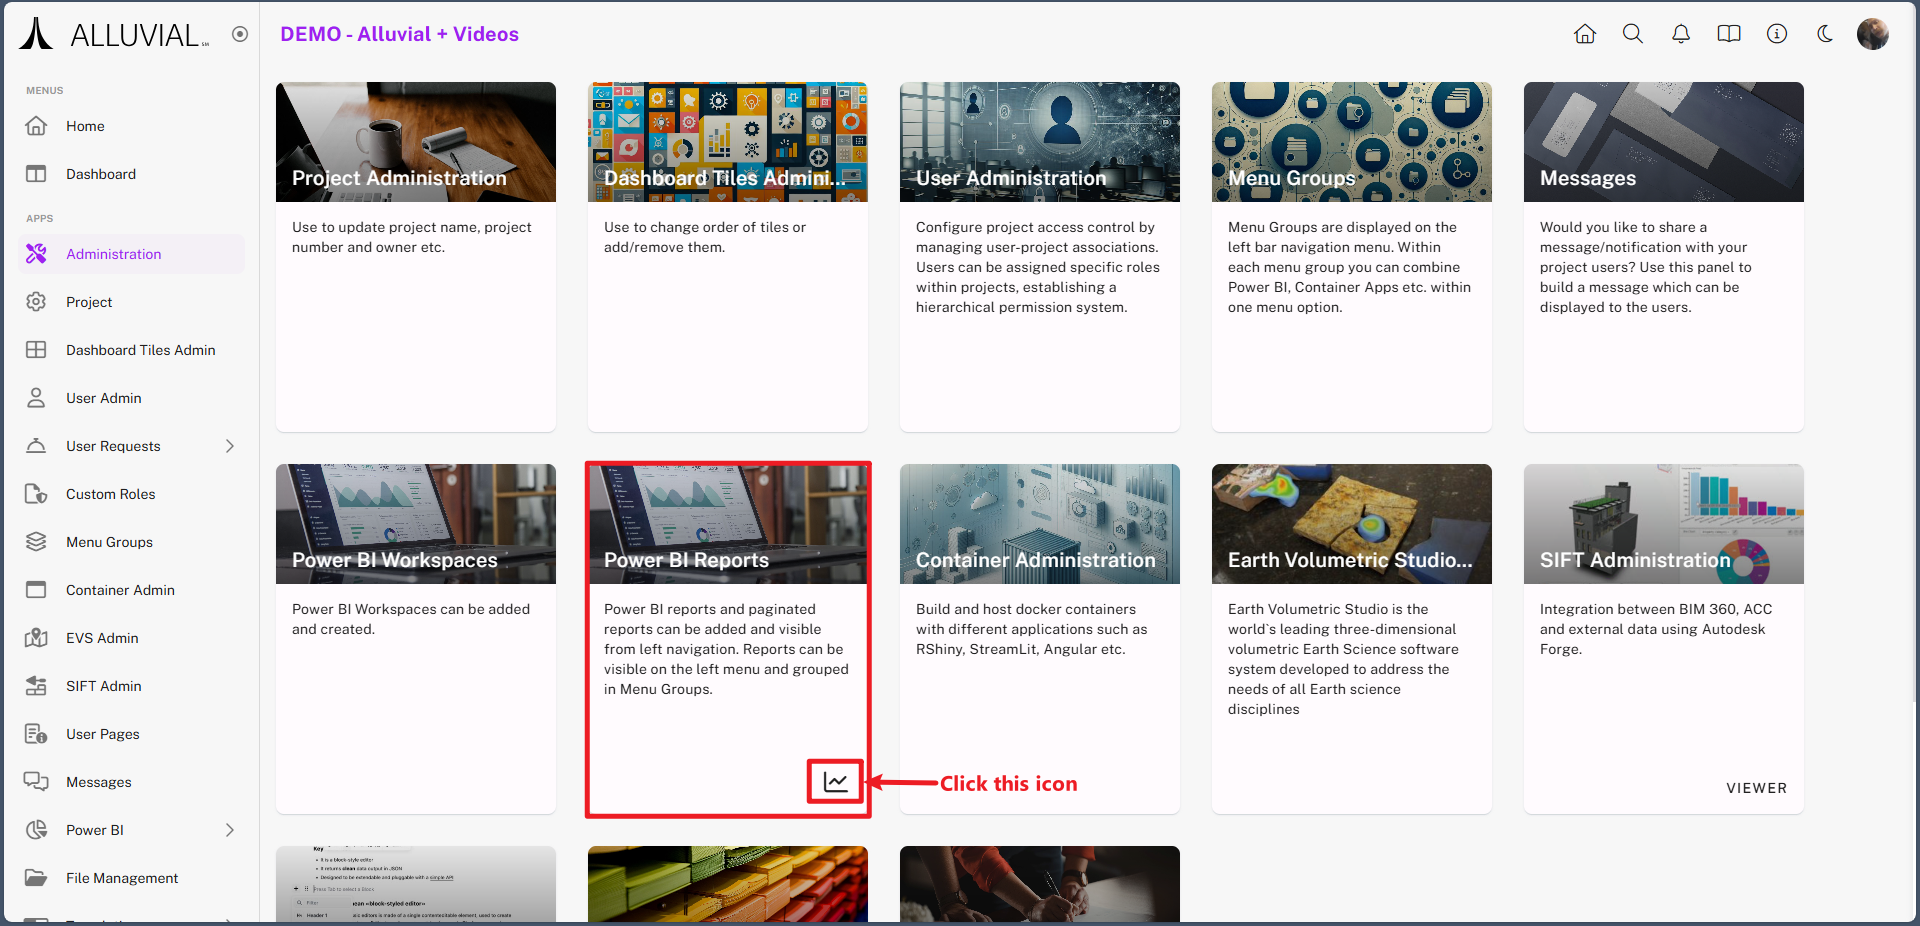
- Go to the administration page for your project.
- In the Power BI Reports card, click Statistics.
Core Concepts
What the Dashboard Measures
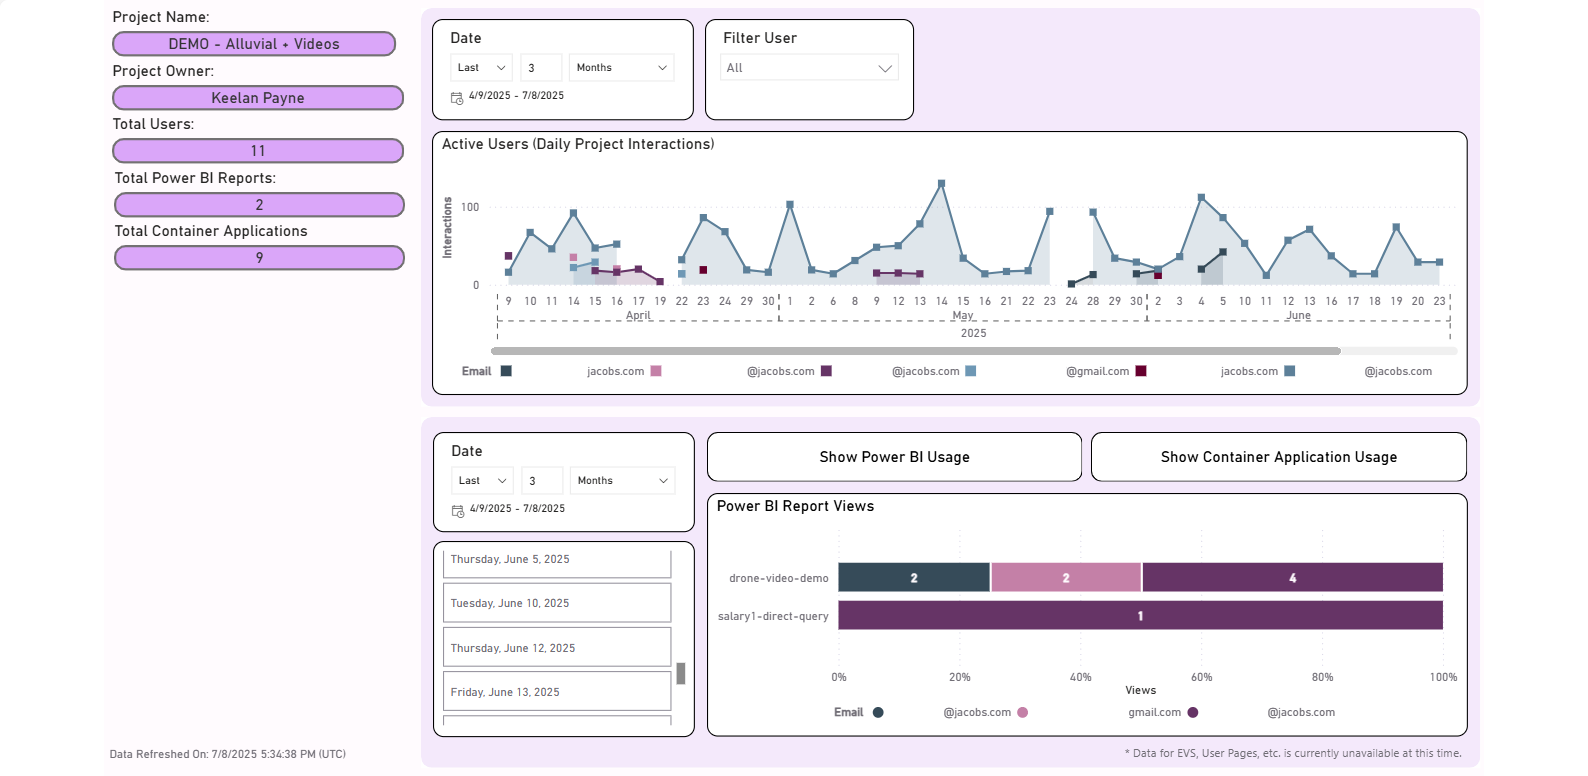
The dashboard displays:
- Power BI usage
- Container application usage
- Overall user interactions across the project
Filters
You can use the built-in filters to refine results by:
- Date range
- User
This allows you to generate targeted insights for performance monitoring and usage tracking.
IMPORTANT: Metrics are estimates generated from page clicks and page views. They may not represent exact usage counts.
Common Tasks
Review Usage Trends
Use the dashboard to review how users are interacting with Power BI reports, container applications, and project content over time.
Filter Results
Use the built-in filters to narrow the results by date range or user when you need more targeted insights.